Home Topics Functions & Graphs

Functions & Graphs

Master every graph family, sketch transformations, and handle inverse functions with confidence. Notes, past papers and a quiz — everything for this topic is one click away.

CAPS alignedGrade 12Paper 1Interactive notes
Guided Course Slides
Quick checks: 0/0
Grade 12 CAPS Mathematics

Functions & Graphs

Every graph family, transformations, inverses, and interpretation.

The Sketching Routine

Use the same drawing order for every family so you never start a graph question from scratch.

Big idea

Use one sketching routine for every graph question.

The 6-step routine
1

Identify the family from the equation.

2

Draw the fixed features first: intercept, turning point, axis of symmetry, or asymptotes.

3

Calculate one or two anchor points.

4

Draw the correct shape cleanly.

5

Read what the question is really asking.

6

Label every required feature.

Note
Recognise the graph type, draw the key feature first, then analyse and interpret the finished sketch.

Core Graph Forms

The six equations everything in this lesson is built from.

Straight line
\[y = mx + c\]
Quadratic
\[y = a(x-p)^2 + q\]
Hyperbola
\[y = \frac{a}{x-p} + q\]
Exponential
\[y = ab^{x-p} + q\]
Logarithm
\[y = \log_b(x-p) + q\]
Average gradient
\[m = \frac{y_2-y_1}{x_2-x_1}\]
Why these six
Every Grade 12 Paper 1 graph question is one of these six forms, its inverse, or a transformation of one — recognising the form on sight is step 1 of the sketching routine.

Functions, Relations and Inverses

Before you sketch any family, be clear about what a function is and how an inverse is formed.
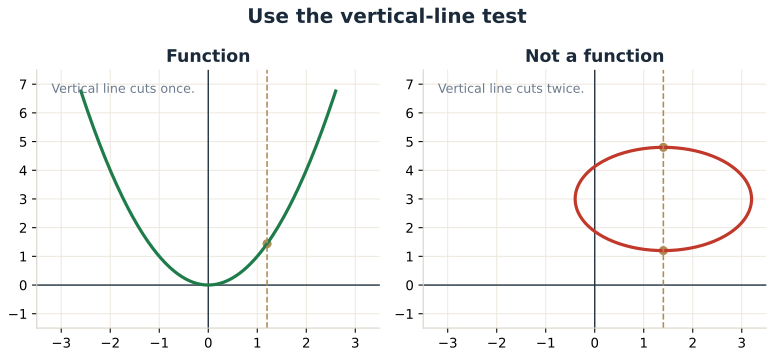
Vertical line test showing one graph that is a function and one graph that is not a function
Vertical-line test: if a vertical line cuts the graph more than once, the relation is not a function.
What is a function?

A function is a rule where each x-value gives only one y-value.

Vertical-line test

If a vertical line touches the graph twice, it is not a function.

Domain and range

Domain is the set of allowed x-values. Range is the set of resulting y-values.

Inverse idea

An inverse reverses the mapping. On a graph, it is a reflection in \(y=x\), so domain and range swap.

Inverse relationship
\[\text{Domain of } f = \text{Range of } f^{-1}\]

If the original graph is not one-to-one, you must restrict the domain before its inverse can also be a function.

Quick Check

A relation fails the vertical-line test. This means:

If \(f(3)=7\), what do we know about \(f^{-1}\)?

Straight Lines

Start with the intercept, then use the gradient to place a second point.
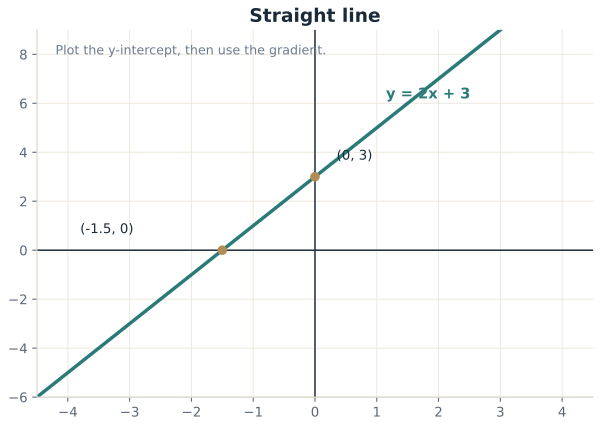
Straight line graph with labelled x-intercept and y-intercept
Drawing move: one intercept and one extra point are enough to fix the whole line.
General form
\[y = mx + c\]
  • \(m\) is the gradient
  • \(c\) is the y-intercept
Gradient meaning
  • \(m > 0\): line rises to the right
  • \(m < 0\): line falls to the right
  • \(m = 0\): horizontal line
How to sketch
  • Plot \((0,c)\)
  • Use the gradient for a second point
What to label
  • x-intercept
  • y-intercept
Why it's straight
The gradient \(m\) is a constant rate of change — every 1-unit step in \(x\) changes \(y\) by exactly \(m\), every time. A constant rate of change is what makes a graph straight rather than curved.
Worked example Level 1-2

Sketch the line \(f(x)=2x+3\) and state both intercepts.

Show solution
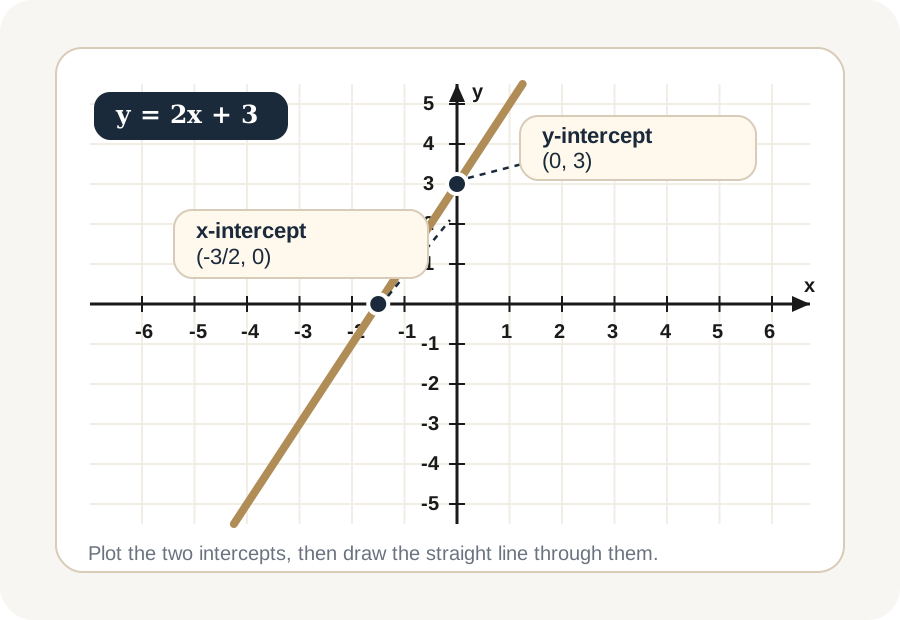
Sketch of y equals 2x plus 3 with x-intercept at negative three over two comma zero and y-intercept at zero comma three
Sketch: mark the y-intercept \((0,3)\), mark the x-intercept \(\left(-\tfrac{3}{2},0\right)\), then draw the straight line through both points.
  1. 1Find the y-intercept by letting \(x=0\): \(y=2(0)+3=3\). So the graph crosses the y-axis at \((0,3)\).
  2. 2Find the x-intercept by letting \(y=0\): \(0=2x+3 \Rightarrow x=-\tfrac{3}{2}\). So the graph crosses the x-axis at \(\left(-\tfrac{3}{2},0\right)\).
  3. 3Plot \((0,3)\) and \(\left(-\tfrac{3}{2},0\right)\), then draw one straight line through the two points.
Worked example Level 3-4

A line passes through \((-1,9)\) and \((3,-3)\). Determine its equation, then state both intercepts.

Show solution
  1. 1Find the gradient using both points: \(m=\dfrac{y_2-y_1}{x_2-x_1}=\dfrac{-3-9}{3-(-1)}=\dfrac{-12}{4}=-3\).
  2. 2Substitute \(m=-3\) and the point \((3,-3)\) into \(y-y_1=m(x-x_1)\): \(y-(-3)=-3(x-3)\).
  3. 3Expand and simplify: \(y+3=-3x+9 \Rightarrow y=-3x+6\). So \(\boxed{f(x)=-3x+6}\).
  4. 4y-intercept: let \(x=0\): \(y=6\), so \((0,6)\). x-intercept: let \(y=0\): \(0=-3x+6 \Rightarrow x=2\), so \((2,0)\).
Quick Check

For \(y=mx+c\), doubling \(m\) while keeping \(c\) fixed:

Given \(f(x)=-4x+8\), the x-intercept is:

Quadratic Graphs

The turning point and the axis of symmetry control the whole parabola.
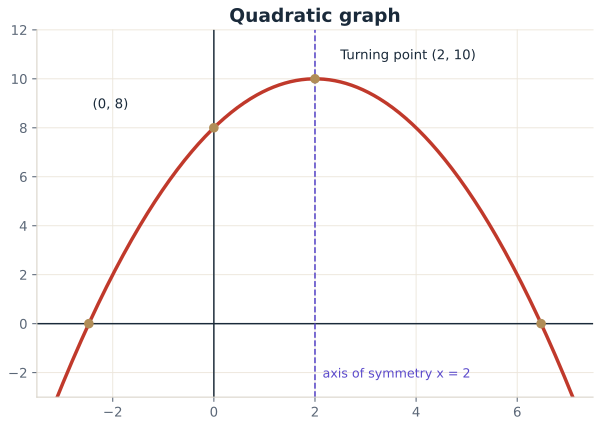
Quadratic graph with turning point, axis of symmetry, and intercepts
Drawing move: place the turning point first, then mirror points across the axis of symmetry.
Useful forms
\[y=a(x-p)^2+q\]

This form shows the turning point immediately.

Turning point
\[\text{Turning point}=(p,q)\]
\[\text{Axis of symmetry}: x=p\]
Shape from \(a\)
  • \(a > 0\): opens up
  • \(a < 0\): opens down
How to sketch
  • Plot turning point
  • Find one or two intercepts
  • Mirror points and draw a smooth curve
Why the sign of \(a\) decides direction
\((x-p)^2\) is a square, so it can never be negative. Multiplying by a positive \(a\) keeps values \(\geq q\) (a minimum, opens up); multiplying by a negative \(a\) flips them to \(\leq q\) (a maximum, opens down).
Worked example Level 1-2

For \(f(x)=(x-1)^2-4\), determine the turning point, the y-intercept, and the x-intercepts.

Show solution
  1. 1The equation is already in turning-point form \(a(x-p)^2+q\), so the turning point is \(\boxed{(1,-4)}\).
  2. 2y-intercept: let \(x=0\): \(f(0)=(0-1)^2-4=1-4=-3\), so \((0,-3)\).
  3. 3x-intercepts: let \(f(x)=0\): \((x-1)^2=4 \Rightarrow x-1=\pm2 \Rightarrow x=3\) or \(x=-1\).
Worked example Level 3

A quadratic has turning point \((2,10)\) and y-intercept \((0,8)\). Determine its equation.

Show solution
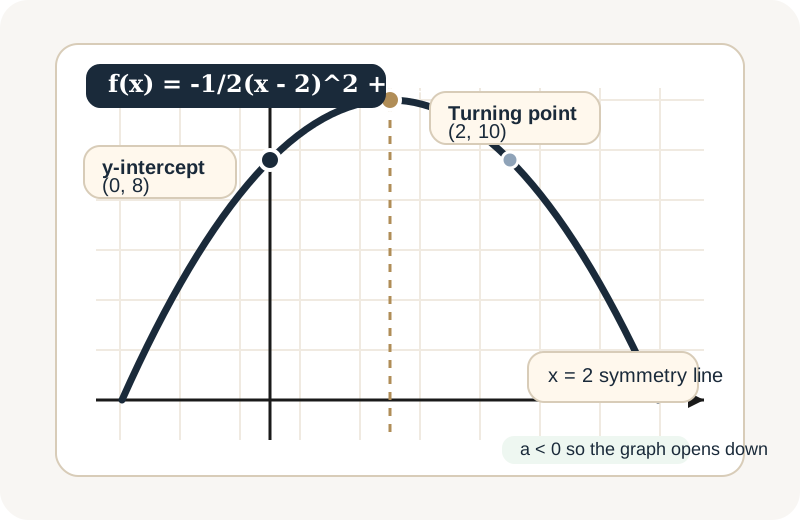
Quadratic sketch with turning point at two comma ten, y-intercept at zero comma eight, and axis of symmetry x equals two
Sketch: start with the turning point \((2,10)\), place the y-intercept \((0,8)\), reflect that point across \(x=2\), and note that the parabola opens downward.
  1. 1Use turning-point form: \(f(x)=a(x-2)^2+10\).
  2. 2Substitute the y-intercept \((0,8)\): \(8=a(0-2)^2+10\).
  3. 3So \(8=4a+10 \Rightarrow 4a=-2 \Rightarrow a=-\tfrac12\).
  4. 4Therefore, \(\boxed{f(x)=-\tfrac12(x-2)^2+10}\).
Quick Check

A parabola has turning point \((3,-5)\) and \(a>0\). Its range is:

The x-intercepts of \(f(x)=2(x-1)^2-8\) are:

Hyperbolas

For a hyperbola, the asymptotes come first. The branches are drawn around them.
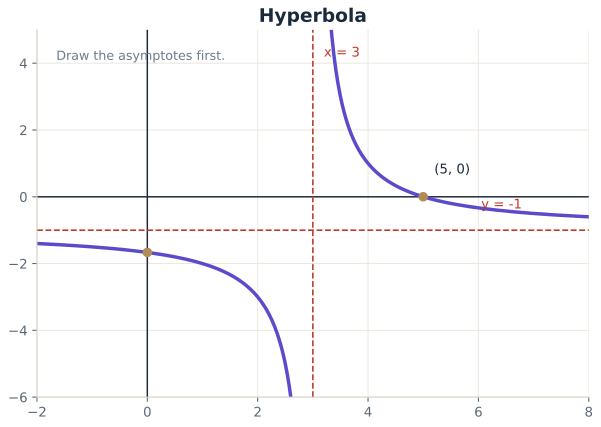
Hyperbola with vertical and horizontal asymptotes and labelled intercept
Drawing move: do not begin with the curve. Begin with the asymptotes \(x=p\) and \(y=q\).
General form
\[y=\dfrac{a}{x-p}+q\]

Vertical asymptote: \(x=p\). Horizontal asymptote: \(y=q\).

Sign of \(a\)
  • \(a>0\): branches top-right and bottom-left
  • \(a<0\): branches top-left and bottom-right
Domain and range

Domain: \(x \in \mathbb{R},\; x \ne p\). Range: \(y \in \mathbb{R},\; y \ne q\).

How to sketch
  • draw both asymptotes
  • find intercepts or one anchor point
  • draw both arms without touching the asymptotes
Why \(x\neq p\)
Division by zero is undefined, so \(x-p\) can never equal zero — the graph is forced to break into two separate branches either side of the vertical asymptote, and can never actually touch it.
Worked example Level 1

For \(f(x)=\dfrac{2}{x-3}-1\), write down the asymptotes, the x-intercept, the domain, and the range.

Show solution
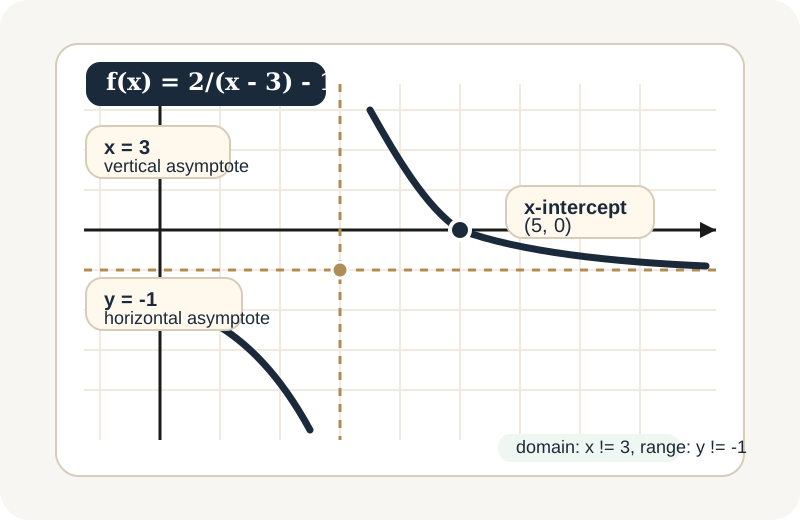
Hyperbola sketch for two over x minus three minus one with asymptotes x equals three and y equals negative one and x-intercept at five comma zero
Sketch: draw the asymptotes first, then place the x-intercept \((5,0)\), and shape the branches around the centre \((3,-1)\).
  1. 1From \(y=\dfrac{a}{x-p}+q\), the asymptotes are \(x=3\) and \(y=-1\).
  2. 2For the x-intercept, let \(y=0\): \(0=\dfrac{2}{x-3}-1\).
  3. 3Then \(\dfrac{2}{x-3}=1 \Rightarrow x-3=2 \Rightarrow x=5\). So the x-intercept is \((5,0)\).
  4. 4Domain: \(x \in \mathbb{R}, x \neq 3\). Range: \(y \in \mathbb{R}, y \neq -1\).
Worked example Level 3-4

The graph below has asymptotes \(x=2\) and \(y=1\), and passes through \((4,3)\). Determine the equation in the form \(y=\dfrac{a}{x-p}+q\).

A hyperbola with asymptotes x equals two and y equals one, passing through four comma three A hyperbola with vertical asymptote x equals two and horizontal asymptote y equals one, with a marked point at four comma three on the upper branch, and the lower branch crossing the x-axis at negative two comma zero. x = 2 y = 1 (4,3) (-2,0)
Reading the diagram: the asymptotes fix \(p\) and \(q\) immediately; the marked point then solves for \(a\).
Show solution
  1. 1The vertical asymptote gives \(p\): \(x=2 \Rightarrow p=2\). The horizontal asymptote gives \(q\): \(y=1 \Rightarrow q=1\).
  2. 2Substitute into \(y=\dfrac{a}{x-p}+q\): \(y=\dfrac{a}{x-2}+1\).
  3. 3Use the point \((4,3)\) to solve for \(a\): \(3=\dfrac{a}{4-2}+1 \Rightarrow 2=\dfrac{a}{2} \Rightarrow a=4\).
  4. 4So the equation is \(\boxed{y=\dfrac{4}{x-2}+1}\).
Quick Check

For \(y=\dfrac{a}{x-p}+q\) with \(a<0\), the branches lie in which pair of quadrants relative to the asymptotes?

A hyperbola has asymptotes \(x=-2\) and \(y=5\). In \(y=\dfrac{a}{x-p}+q\):

Exponential Graphs

Exponential graphs are controlled by a horizontal asymptote and the growth or decay pattern.
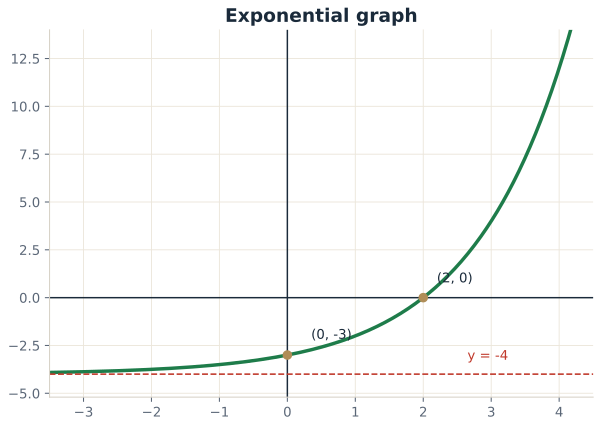
Exponential graph with horizontal asymptote and labelled intercepts
Drawing move: sketch the asymptote first, then place the intercepts and decide whether the graph grows or decays.
General form

\(y=ab^{x-p}+q\), where \(b>0\) and \(b\neq1\)

Asymptote

Horizontal asymptote \(y=q\). No vertical asymptote.

Growth or decay
  • \(b>1\): growth
  • \(0<b<1\): decay
Domain and range
  • domain is all real numbers
  • range depends on \(a\) and \(q\)
Why there's no vertical asymptote
\(b^{x-p}\) is defined for every real \(x\) — no denominator, no square root — so nothing restricts the domain. The asymptote is horizontal only, because \(b^{x-p}\to0\) but never reaches \(0\) as \(x\to-\infty\), leaving the graph forever above (or below) \(y=q\).
Worked example Level 1

Given \(h(x)=2^x-4\), determine the asymptote, intercepts, and range.

Show solution
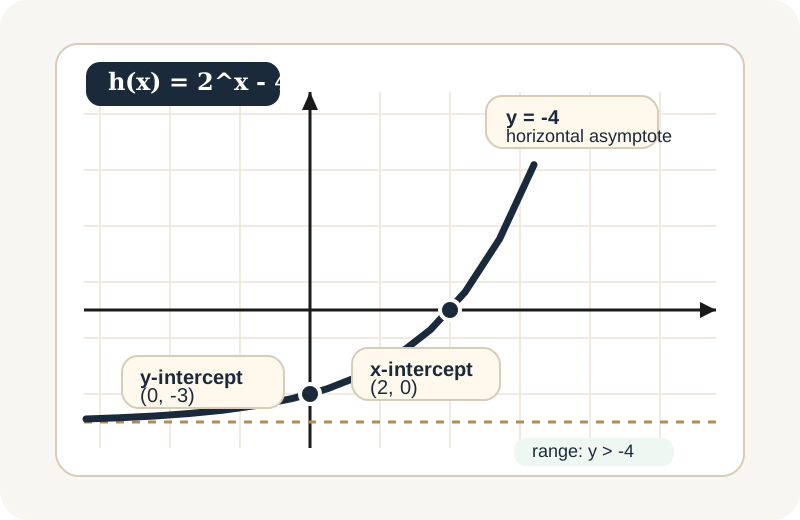
Exponential sketch for two to the power x minus four with asymptote y equals negative four, y-intercept at zero comma negative three, and x-intercept at two comma zero
Sketch: place the horizontal asymptote \(y=-4\), mark the intercepts \((0,-3)\) and \((2,0)\), then draw the increasing exponential curve above the asymptote.
  1. 1The asymptote is \(y=-4\).
  2. 2y-intercept: \(h(0)=2^0-4=1-4=-3\), so \((0,-3)\).
  3. 3x-intercept: \(0=2^x-4 \Rightarrow 2^x=4=2^2\), so \(x=2\), giving \((2,0)\).
  4. 4Because the graph lies above the asymptote, the range is \(y>-4\).
Worked example Level 3-4

The graph below has asymptote \(y=-2\) and passes through \((0,-1)\) and \((1,1)\). Determine the equation in the form \(y=ab^x+q\).

An increasing exponential graph with asymptote y equals negative two, passing through zero comma negative one and one comma one An exponential curve rising from left to right with horizontal asymptote y equals negative two, marked points at zero comma negative one and one comma one. y = -2 (0,-1) (1,1)
Reading the diagram: the asymptote gives \(q\) immediately; the two points then give two equations to solve for \(a\) and \(b\).
Show solution
  1. 1The horizontal asymptote gives \(q\): \(y=-2 \Rightarrow q=-2\).
  2. 2Substitute \((0,-1)\) into \(y=ab^x-2\): \(-1=ab^0-2 \Rightarrow -1=a-2 \Rightarrow a=1\).
  3. 3Substitute \((1,1)\) with \(a=1\): \(1=(1)b^1-2 \Rightarrow 1=b-2 \Rightarrow b=3\).
  4. 4So the equation is \(\boxed{y=3^x-2}\).
Quick Check

For \(y=ab^{x-p}+q\) with \(a<0\) and \(b>1\), the graph:

The range of \(f(x)=-3(2)^x+6\) is:

Logarithmic Graphs

A logarithmic graph is the inverse of an exponential graph, so it can be read as a reflection in \(y=x\).
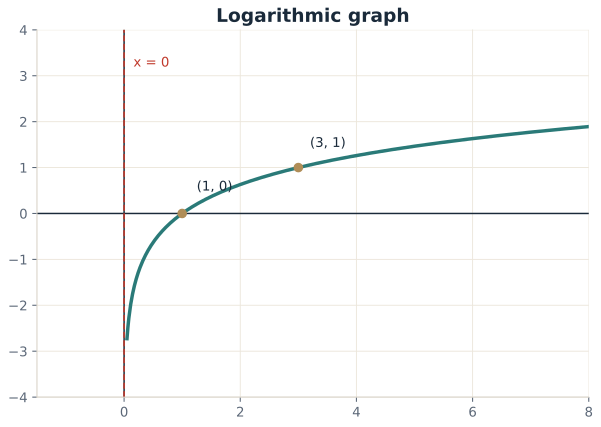
Logarithmic graph with vertical asymptote and labelled points
Drawing move: place the vertical asymptote first, then use a known point such as \((1,0)\) on the basic graph.
General form
\[y=\log_b(x-p)+q\]
Asymptote and domain

Vertical asymptote \(x=p\). Domain \(x>p\).

Basic graph facts
\[y=\log_b x\]
  • passes through \((1,0)\)
  • if \(b>1\), increases; if \(0<b<1\), decreases
Range

\(y \in \mathbb{R}\)

Why it's the exponential's inverse
Swapping \(x\) and \(y\) in \(y=ab^{x-p}+q\) and solving for \(y\) produces a logarithm — that swap is also why the exponential's range becomes the logarithm's domain, and its horizontal asymptote \(y=q\) becomes a vertical one, \(x=p\).
Worked example Level 1

If \(g(x)=3^x\), write the inverse in the form \(y=\ldots\), then state the x-intercept and asymptote of the inverse.

Show solution
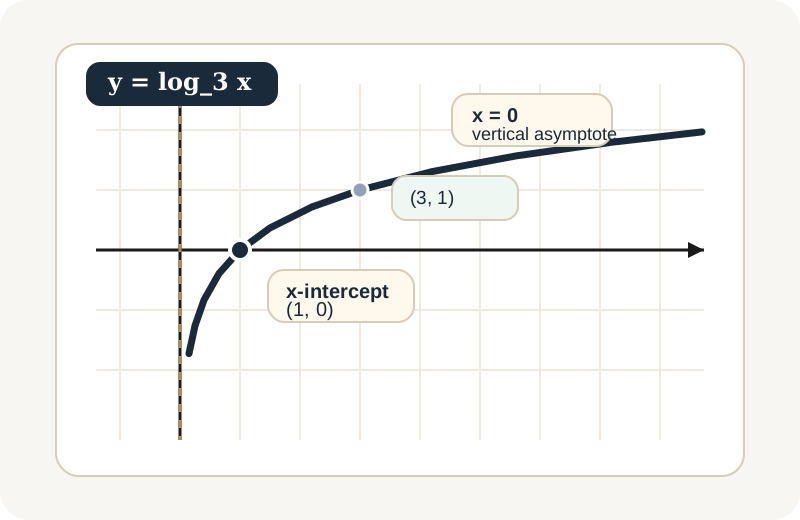
Logarithmic sketch for y equals log base three x with vertical asymptote x equals zero and x-intercept at one comma zero
Sketch: the inverse of \(3^x\) is the logarithmic graph \(y=\log_3 x\), so it crosses the x-axis at \((1,0)\) and approaches the asymptote \(x=0\).
  1. 1Write \(y=3^x\), swap \(x\) and \(y\): \(x=3^y\).
  2. 2Solve for \(y\): \(\boxed{y=\log_3 x}\).
  3. 3x-intercept: \(0=\log_3 x \Rightarrow x=1\), so \((1,0)\).
  4. 4The inverse has vertical asymptote \(x=0\).
Quick Check

The inverse of \(y=b^x\) is:

For \(y=\log_5(x-3)\), the vertical asymptote and domain are:

Inverse Functions

Think in two ways at once: algebraically by swapping \(x\) and \(y\), and graphically by reflecting in \(y=x\).
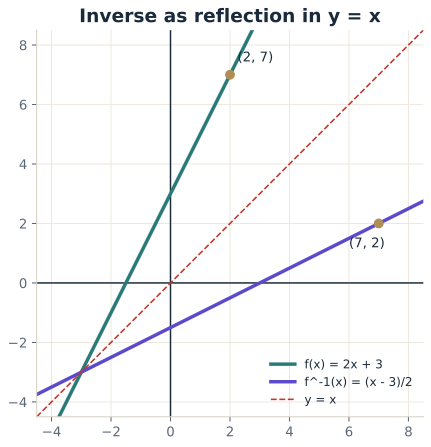
Line and its inverse reflected across y equals x
Key visual: a point \((a,b)\) on \(f\) becomes \((b,a)\) on \(f^{-1}\).
Algebra method
1

Write \(y=f(x)\).

2

Swap \(x \leftrightarrow y\).

3

Solve for \(y\).

Graph method

Reflect the graph in \(y=x\): \((x,y)\mapsto(y,x)\).

Domain/range swap
First
\[\operatorname{Dom}(f)=\operatorname{Ran}(f^{-1})\]
Second
\[\operatorname{Ran}(f)=\operatorname{Dom}(f^{-1})\]
Quadratic warning

A full quadratic does not have a functional inverse until the domain is restricted: \(x\geq p\) or \(x\leq p\).

Worked example — a simple linear inverse Level 1

Find the inverse of \(f(x)=4x-8\).

Show solution
  1. 1Write \(y=4x-8\).
  2. 2Swap \(x\) and \(y\): \(x=4y-8\).
  3. 3Solve for \(y\): \(x+8=4y \Rightarrow \boxed{f^{-1}(x)=\dfrac{x+8}{4}}\).
Worked example Level 3-4

Find the inverse of \(f(x)=2x+3\). Also explain why the inverse of \(f(x)=x^2\) is not a function unless the domain is restricted.

Show solution
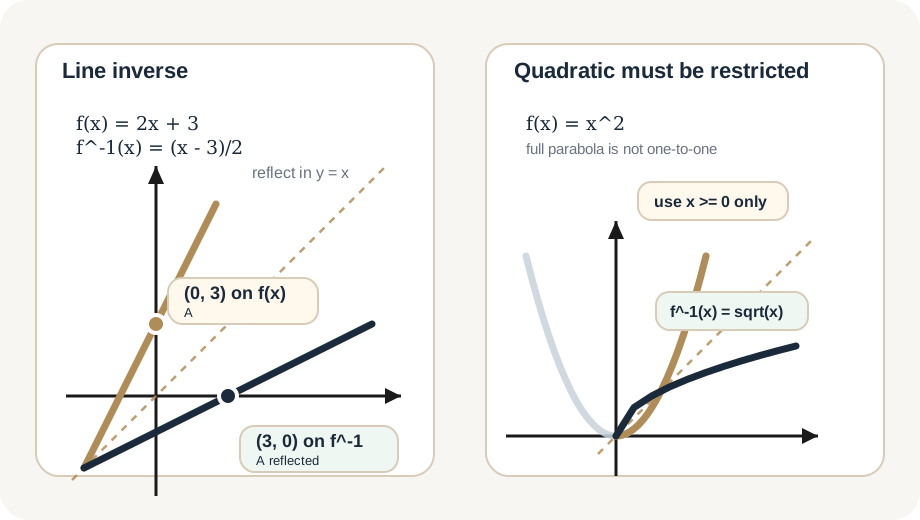
Two inverse function diagrams: a line and its inverse reflected in y equals x, and a quadratic restricted to x greater than or equal to zero before using y equals square root x as the inverse
Visual idea: inverse points swap across \(y=x\). The line works immediately, but the quadratic must be restricted first so the inverse becomes a function.
  1. 1Write \(y=2x+3\).
  2. 2Swap \(x\) and \(y\): \(x=2y+3\).
  3. 3Solve for \(y\): \(x-3=2y \Rightarrow y=\dfrac{x-3}{2}\). So \(\boxed{f^{-1}(x)=\dfrac{x-3}{2}}\).
  4. 4For \(f(x)=x^2\): swap \(x\) and \(y\) to get \(x=y^2\), so \(y=\pm\sqrt{x}\) — one x-value gives two y-values, so this is not a function.
  5. 5If the original domain is restricted to \(x\geq0\), the inverse becomes \(\boxed{f^{-1}(x)=\sqrt{x}}\), which is a function.
Quick Check

To find the inverse of \(y=f(x)\) algebraically, you:

The inverse of \(f(x)=x^2\) is only a function if:

Transformations

Transformations move a known graph without changing its family.
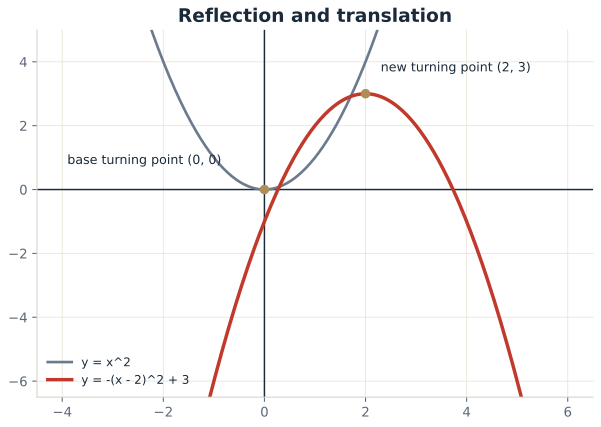
Base quadratic and transformed quadratic showing reflection and translation
Reading rule: inside the bracket changes horizontal position, while outside the bracket changes vertical position.
Transformation language
1

\(y=f(x)+q\): move up/down by \(q\).

2

\(y=f(x-p)\): move right/left by \(p\).

3

\(y=-f(x)\): reflect in the x-axis.

4

\(y=f(-x)\): reflect in the y-axis.

5

\(y=af(x)\): vertical stretch/compression.

Fast reading tip
Changes inside the bracket affect horizontal position; changes outside affect vertical position.
Worked example Level 1

Describe the transformation from \(y=x^2\) to \(y=-(x-2)^2+3\).

Show solution
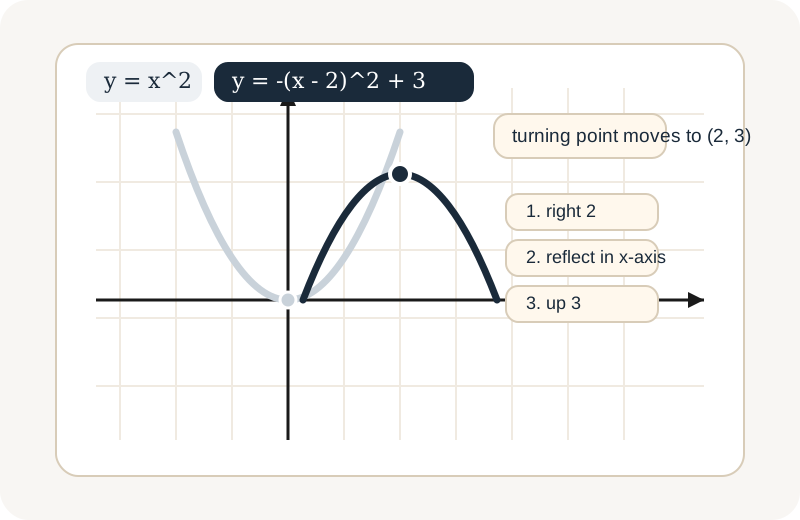
Transformation sketch showing the base parabola y equals x squared and the transformed parabola y equals negative x minus two squared plus three
Sketch: compare the basic parabola with the transformed one so you can read the movement in order: right 2, reflect in the x-axis, then up 3.
  1. 1\((x-2)\) means shifted 2 units right.
  2. 2The negative sign means reflected in the x-axis.
  3. 3\(+3\) outside means shifted 3 units up.
  4. 4Full description: right 2, reflect in the x-axis, up 3.
Quick Check

The transformation \(y=f(x-3)\) shifts the graph:

\(y=-f(x)\) compared to \(y=f(x)\) is a:

Reading Graphs, Domain, Range and Average Gradient

Once the graph is sketched, most exam questions become interpretation questions.
Curve with two points joined by a secant line to show average gradient
Average gradient: use the gradient of the secant line between two points, not the shape of the curve in between.
Domain and range

Read domain left to right on the x-axis. Read range bottom to top on the y-axis.

Intercepts
  • x-intercept: let \(y=0\)
  • y-intercept: let \(x=0\)
Intersections

Two graphs intersect where their equations are equal — solve simultaneously.

Average gradient

\(\displaystyle m=\frac{y_2-y_1}{x_2-x_1}\). This is not the derivative.

Note
Before you leave a graph question, ask yourself: Did I label the intercepts? Did I label asymptotes or the turning point? Did I state domain and range in the correct notation when the question asked for them?
Worked example — reading intercepts Level 1-2

For \(f(x)=x^2-4\), determine the x-intercepts and the y-intercept.

Show solution
  1. 1y-intercept: let \(x=0\). \(f(0)=0-4=\boxed{-4}\), so \((0,-4)\).
  2. 2x-intercepts: let \(f(x)=0\). \(x^2-4=0 \Rightarrow x^2=4 \Rightarrow x=\pm2\).
  3. 3So the x-intercepts are \(\boxed{(-2,0)}\) and \(\boxed{(2,0)}\).
Worked example — average gradient Level 3

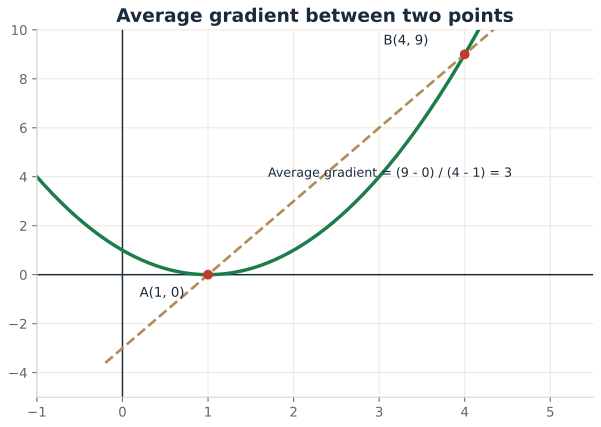
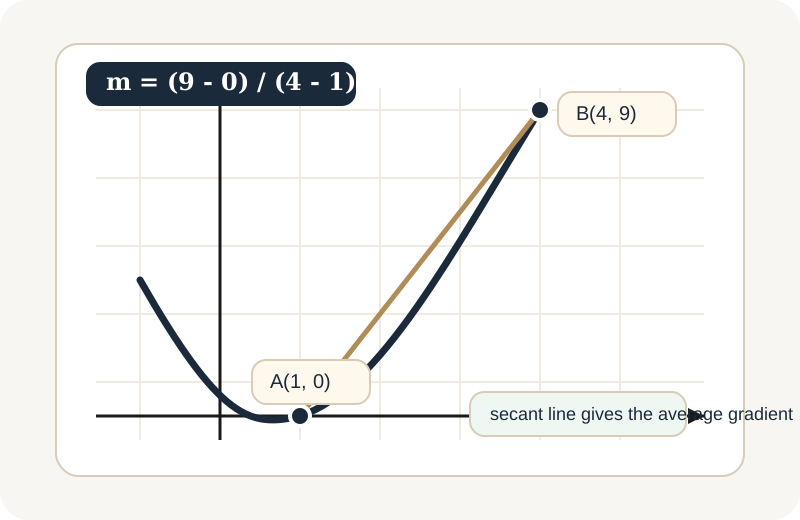
The points \(A(1,0)\) and \(B(4,9)\) lie on a curve. Determine the average gradient between the two points.

Show solution
Curve with points A at one comma zero and B at four comma nine joined by a secant line to show average gradient
Sketch: the average gradient comes from the secant joining \(A(1,0)\) and \(B(4,9)\), so you use the change in y over the change in x between those two points.
  1. 1Use \(\displaystyle m=\frac{y_2-y_1}{x_2-x_1}\).
  2. 2Substitute: \(\displaystyle m=\frac{9-0}{4-1}=\frac{9}{3}=3\).
  3. 3Therefore, the average gradient is \(\boxed{3}\).

Combined Graphs and Inequalities

Paper 1 regularly puts two graphs on the same set of axes and asks where one is above, below, or equal to the other.

Step 1: Find the intersections

Set \(f(x)=g(x)\) and solve. These x-values are where the two graphs cross — the boundary points for any inequality question.

Step 2: Find the y-values

Substitute each x-value back into either equation to get the intersection points as coordinates.

Step 3: Read the inequality from the sketch

Between two intersection points, one graph is consistently above the other. Pick any x-value in that interval, evaluate both functions, and see which is bigger — the sketch then tells you the full solution set.

Common phrasing
  • “For which values of \(x\) is \(f(x) \geq g(x)\)?”
  • “For which values of \(x\) is \(f(x)\cdot g(x) \leq 0\)?”
Note
You almost never need to test every x-value algebraically — the sketch already shows you which graph is on top in each region. Use algebra only to find the exact boundary (intersection) points.
Worked example Level 4

Given \(f(x)=-(x-1)^2+4\) and \(g(x)=x+1\), determine the points of intersection, and the values of \(x\) for which \(f(x)\geq g(x)\).

A downward parabola and a straight line intersecting at two points The parabola f of x equals negative open bracket x minus one close bracket squared plus four, and the line g of x equals x plus one, intersecting at negative one comma zero and two comma three. The parabola lies above the line between these two points. (-1,0) (2,3) f(x) g(x)
Reading the diagram: the parabola \(f\) (navy) sits above the line \(g\) (grey) exactly between the two intersection points.
Show solution
  1. 1Set \(f(x)=g(x)\): \(-(x-1)^2+4=x+1\).
  2. 2Expand: \(-(x^2-2x+1)+4=x+1 \Rightarrow -x^2+2x+3=x+1\).
  3. 3Rearrange: \(-x^2+x+2=0 \Rightarrow x^2-x-2=0 \Rightarrow (x-2)(x+1)=0\).
  4. 4So \(x=2\) or \(x=-1\). Substituting into \(g(x)=x+1\): \(g(2)=3\) and \(g(-1)=0\).
  5. 5The intersection points are \(\boxed{(-1,0)}\) and \(\boxed{(2,3)}\).
  6. 6Testing \(x=0\) (between the two intersections): \(f(0)=3\) and \(g(0)=1\), so \(f(0)>g(0)\) — the parabola is above the line in this interval.
  7. 7Therefore \(\boxed{f(x)\geq g(x)\text{ for } -1\leq x\leq 2}\).
Quick Check

On a sketch, two graphs \(f\) and \(g\) cross at \(x=2\) and \(x=5\). Between these values, \(f(x)>g(x)\). The solution to \(f(x)\geq g(x)\) is:

The average gradient between two points on a curve equals:

1 / 33

What CAPS Expects You to Know

The Grade 12 Functions knowledge statements this page is built from.

  1. 1

    Determine whether a relation is a function, identify its domain and range, and understand how restricting a domain affects its inverse.

  2. 2

    Sketch and interpret straight-line, quadratic, hyperbolic, exponential and logarithmic graphs, including finding intercepts and other key features from a given equation.

  3. 3

    Determine the equation of a function from its graph or from given key features such as a turning point, intercepts, or asymptotes.

  4. 4

    Investigate and describe the effect of parameters (shifts, reflections, stretches) on the graph of a known function.

  5. 5

    Determine the equation of the inverse of a function algebraically, and sketch it as a reflection in the line \(y = x\).

  6. 6

    Determine the average gradient between two points on a curve, and interpret graphs to solve intercept and intersection problems.

How to Use This Lesson

A few practical notes before you start.

  • Start with the sketching routine, then work through the graph families one at a time.
  • Finish with inverse functions, transformations, and interpretation.
  • Before you submit an answer, check: correct graph family, intercepts and key features, clear labels.
  • Try each worked example yourself before pressing “Show solution.”

Functions & Graphs, Family by Family

The trickiest ideas for Grade 12: quadratics in turning-point form, hyperbola asymptotes, the exponential/logarithm inverse pair, and inverse functions. Free, independent short videos — not made by Equation Station SA.

Quadratic Graphs

\(y=a(x-p)^2+q\) — turning point \((p,q)\). Plot the turning point first, then mirror one extra point across the axis of symmetry.

Khan Academy · Graphing a parabola in vertex form

Hyperbolas

\(y=\dfrac{a}{x-p}+q\) — asymptotes \(x=p\) and \(y=q\). Draw both asymptotes before either branch of the curve.

Khan Academy · Finding horizontal and vertical asymptotes

Exponential & Logarithm

\(y=ab^{x-p}+q\) and its inverse \(y=\log_b(x-p)+q\) — a logarithmic graph is an exponential graph reflected in \(y=x\).

Khoza Explains · Log and Exponential Functions Inverses Grade 12

Inverse Functions & Transformations

Swap \(x\) and \(y\), solve for \(y\) — and remember, a full quadratic needs a restricted domain before its inverse is a function.

Smart Culture Education · Functions, Inverse Functions and Graphs

Common Exam Mistakes

Avoid these errors. They cost marks every year.

Calling every relation a function

Check whether each input has exactly one output. Use the vertical-line test for graphs instead of guessing from the shape.

Forgetting the restricted domain for an inverse

A quadratic or similar graph may need a restricted domain before its inverse becomes a function.

Missing asymptotes, intercepts, or turning points

Paper 1 sketches must show the key features clearly. A correct shape without labels can still lose marks.

Reading transformations backwards

Inside the brackets affects horizontal movement and often works in the opposite direction learners expect.

Practise This Topic

You've done the notes above — now practise and test yourself.

BANK
Past Papers
Functions & Graphs Past Papers

Exam-style Grade 12 Functions questions arranged by cognitive level, with real citations from the DBE/provincial archive.

Step 1 • Practise • Cognitive Levels
Open Past Papers
TEST
Test Your Knowledge
Functions & Graphs Test Your Knowledge

Auto-marked 22-question quiz with a clear report and printable certificate.

Step 2 • Test Yourself • Auto-Marked + Certificate
Test Your Knowledge

Frequently Asked Questions

Straight answers to common Grade 12 CAPS questions about functions, relations, inverse graphs, and the most important things to remember for Paper 1.

What are Functions and Graphs in Grade 12 Maths?

Functions and Graphs in Grade 12 CAPS includes functions and relations, inverse graphs, domain and range, graph transformations, and the sketching of linear, quadratic, hyperbolic, exponential, and logarithmic graphs.

How do I tell if a relation is a function?

A relation is a function if each input has only one output. For graphs, use the vertical-line test: if any vertical line cuts the graph more than once, it is not a function.

What should I remember first for Functions & Graphs?

Start with function vs relation, domain and range, inverse rules, asymptotes, turning points, and transformation language. Those ideas keep returning in different question styles.

Why must I restrict the domain for some inverse functions?

You restrict the domain when the original function is not one-to-one. This makes sure the inverse also passes the function test.

Which resource should I open first for this topic?

Everything you need to learn the topic is on this page already. Once you've been through the notes above, work through the Past Papers, then finish with the Test Your Knowledge as your final self-check.

How do Functions and Graphs appear in CAPS exams?

CAPS exams usually test whether relations are functions, graph sketching, domain and range, inverse functions, transformations, and interpretation of intersections and asymptotes. These questions are central to Paper 1.